Your entire business might be dependent on data.
But your data is useless if you cannot understand it.
For that, you need a unified system. One that combines your financials and customer data in a single view.
That is where Power BI dashboards come in. They provide the data insights your company needs.
Power BI is a business analytics tool that refines your messy data. It turns into clean, actionable reports.
So, what is Power BI? And how can it help your business?
Don’t worry, as I have created this guide just to answer that question!
With this guide, you will learn how to gain live visuals from your data. These will help you improve your business’s efficiency.
Let’s get started by first understanding the definition of a Power BI dashboard.
What is Power BI? 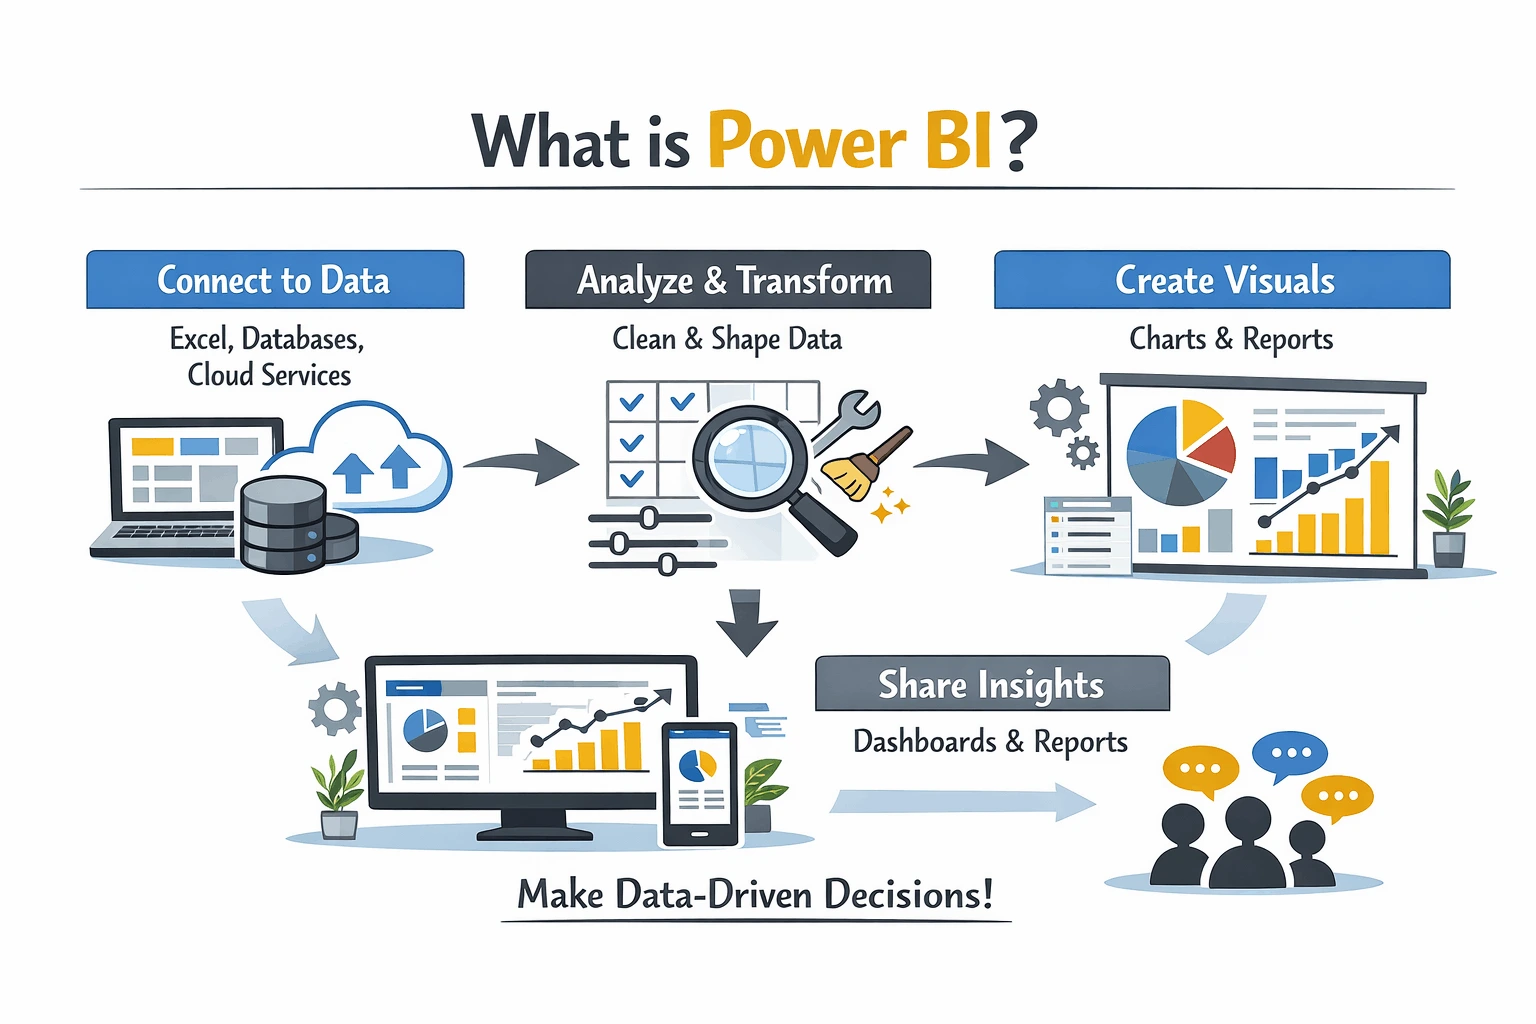
In easy terms, Power BI is a tool that helps you both see and understand your data.
Think of it as a suite of tools used for business analytics that are powered by Microsoft. These tools help you prepare your data for analysis and gain valuable insights.
Here is what makes Power BI reporting so special:
- Visual
Power BI converts your boring data rows into colorful charts and graphs.
- Interactive
Instead of sheets, you will get clickable charts that update automatically.
- Shareable
Boost your teamwork with online reports that work for your entire staff.
Why Businesses Use Power BI for Data Analytics?
Using Power BI for data analytics consulting has become crucial for any modern business.

Here are the reasons why:
-
Connect Everything Seamlessly
You might be juggling multiple sheets and platforms at your workplace every day. Keeping your CRM and accounting separate adds to your workload.
But that is not the case for teams empowered by Power BI features.
With over 100 connections available, Power BI merges your data in a single place. This means no more switching between multiple systems for accurate data.
-
Create Visually Stunning Dashboards
One of the highlights of a Power BI dashboard is how it makes data easy to understand.
Power BI becomes your command center. It provides major metrics at just a glance.
Moreover, it also enables cross-team data integrations. This means easier executions and everyone staying on the same page.
Using Power BI, tracking your sales and inventory also becomes easier than ever!
-
Benefit From Shared Insights Across Your Teams
You might think Power BI is just a tool for analysts.
But in reality, its easy navigation makes it a tool for everyone!
Using Power BI, your teams can collaborate using the same data. This means sharing reports through online Power BI services.
You can also use apps and email subscriptions to make sharing easier. Moreover, Power BI also connects seamlessly with Microsoft Teams and SharePoint.
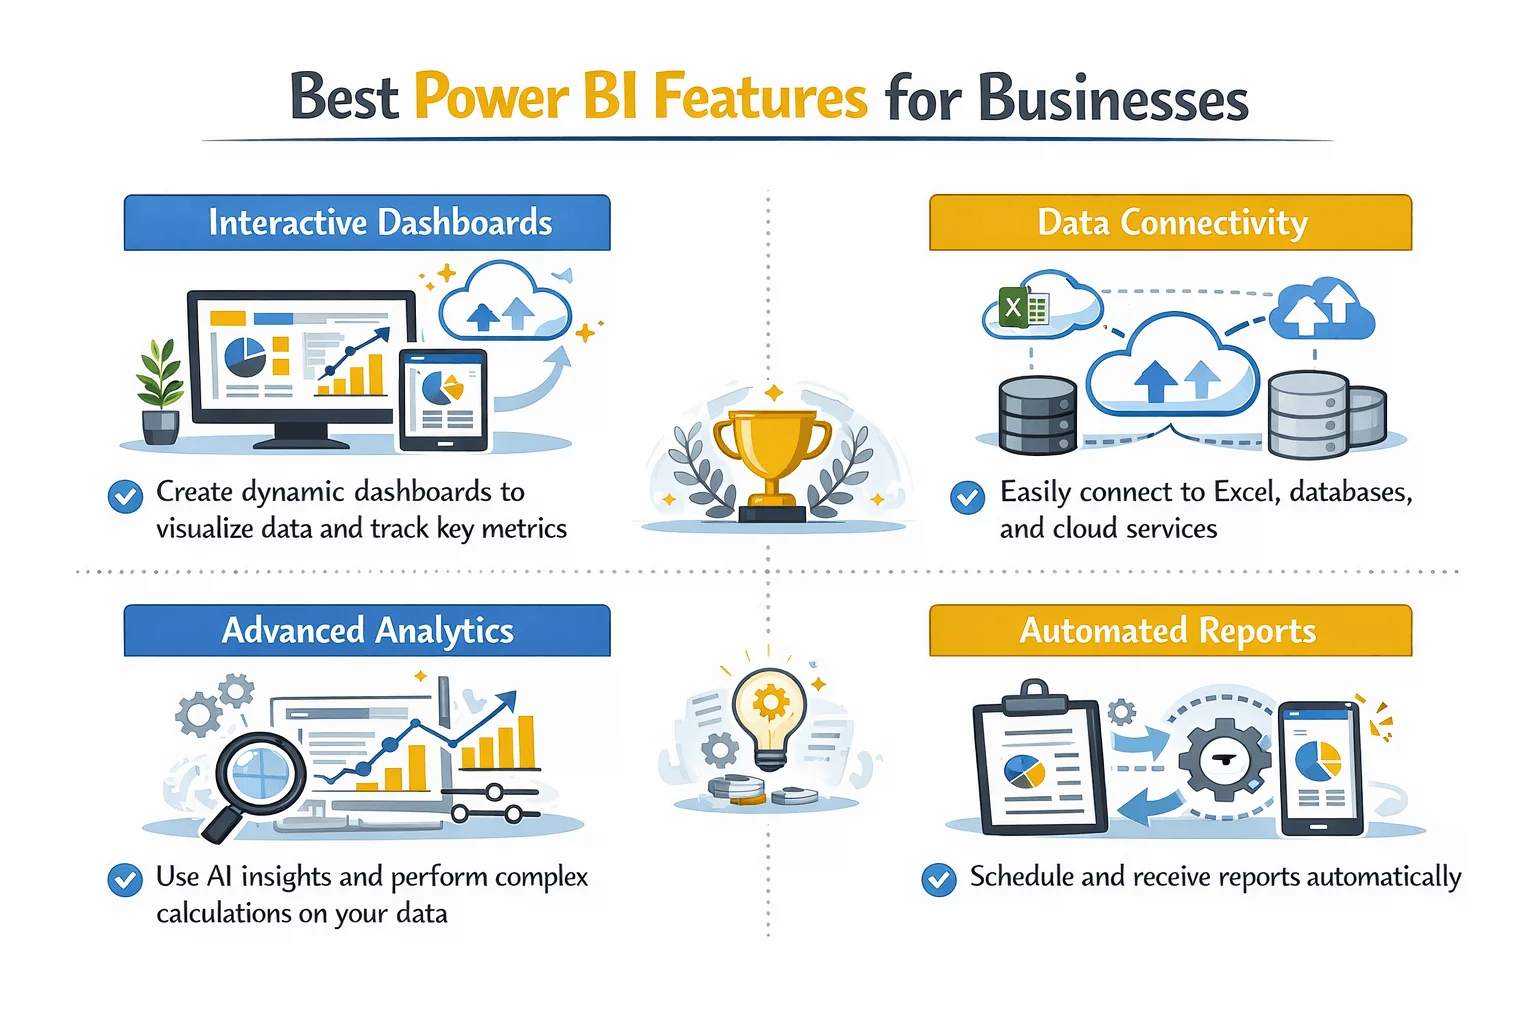
Best Power BI Features For Your Business
While the Power BI features list is long, here are my top recommendations:
-
Rich Visualizations
The core benefit of Power BI is its offering of over 150 data visualization services.
Whether it’s standard charts or complex maps, Power BI has got you covered. It even supports custom visuals you can build yourself.
Using Power BI, you can visualize sales over time and easily gauge performance.
-
Powerful Interactivity
A great benefit of Power BI is how it makes data insights interactive.
Simply click on a visual and all related visuals update automatically.
For example, clicking “Q3” on a sales chart opens your entire quarter. You can then check your profits and customer map neatly on your dashboard.
-
Queries in Natural Language
You don’t need to be an analyst to use Power BI. Just type questions in plain English and see your visuals come alive.
Queries like “show my total sales in this region” work very well. It makes it easier to use Power BI for your business.
-
AI-Powered Insights
Power BI has built-in AI features that track errors and data patterns.
Using them, you can verify your data and generate reports using simple natural language.
Just click on a report or insight and select “Explain this increase”. Power BI will automatically analyze the data to provide an accurate result.
-
Consistent Metrics
Using Power BI, you can create a single source of truth for your entire business.
It computes all of your data to provide consistent answers to your queries. This helps in keeping everyone on the same page.
Power BI Tools Included with the Platform
Here are the Power BI tools you can use through the platform:
| Tool | What It Does | Who It’s For |
| Power BI Desktop | Free desktop app for building reports | Analysts and report creators |
| Power BI Service | Cloud-based sharing and collaboration | Teams needing to share insights |
| Power BI Mobile | iOS and Android apps | On-the-go access to dashboards |
| Power BI Report Builder | Create paginated reports | Finance and operations teams |
| Power BI Embedded | Embed reports in custom apps | Developers |
Power BI Reporting Examples
Using Power BI, you can interactively report on your data.
Here are real-life scenarios where Power BI can help you:
| Report Type | What It Shows | Who Uses It |
| Finance Insights | Trial balance and financial statements | CFO, finance team |
| Sales and Billing | Sales order volumes and revenue trends | Sales director |
| Accounts Payable | Aging reports and payment trends | Accounts payable team |
| Opportunity Insights | Sales pipeline health and deal progression | Sales managers |
Getting Started with Power BI
Are you ready to try Power BI for your business?
Consider following these simple steps:
- Download the free Power BI Desktop platform
- Connect your data sources
- Start building a simple chart by dragging fields across the canvas
- Create your dashboard by pinning your charts
- Finally, share your new dashboard with your team online

Conclusion
So, what is Power BI?
As we have seen, it is a tool that can turn your data into usable insights.
Whether you are a small emerging business or a global enterprise, Power BI can make you more efficient.
It helps save costs and make informed decisions for your business.
But to truly unlock its true potential, you will need a software partner by your side. Someone with real-world experience with Power BI.
For you, that partner is Augmented Systems. They are your best bet towards making Power BI work for your company.
Augmented Systems has decades of experience solving real-world business problems. They can provide you with the Power BI consulting you need.
Their experts can customize Power BI dashboards for your work culture. Moreover, they can also help you create and implement your Power BI dashboards.
Consult Augmented Systems today to start using your data in the best possible way!
FAQs
1. What is Power BI in simple terms?
What is Power BI? It’s Microsoft’s tool that turns your messy data into easy-to-understand charts and dashboards. Think of it as Excel charts on steroids, but interactive and live.
2. What are the main Power BI benefits for businesses?
Power BI benefits include faster decision-making (see data in real time), a single source of truth (everyone uses the same numbers), lower costs (about $10-14 per user per month), and beautiful dashboards anyone can understand.
3. What does a Power BI dashboard look like?
A Power BI dashboard is a single screen that shows your most important metrics at once. This includes sales trends, customer data, and financial performance. Click on any chart, and everything else updates automatically.
4. What Power BI features should I know?
Key Power BI features include 150+ chart types, natural language queries (just type your question), AI-powered insights, and the ability to share reports in Teams or on mobile phones.
5. What Power BI tools are included?
Power BI tools include Power BI Desktop (free for building reports), Power BI Service (cloud sharing), Power BI Mobile (phone apps), and Power BI Report Builder (for printable reports).