With so many options, choosing the right business intelligence tool can be tough
Mainly, you will hear about two main choices. These are
- Tableau
- Power BI
Both are powerful ways of creating beautiful dashboards
But which one is right for you
To answer this question, I have created this detailed guide. It compares the benefits and weaknesses between Tableau and Power BI
Let’s get started.
Tableau vs Power BI: Quick Overview
Here is a short comparison between these two data tools
| Factor | Tableau | Power BI |
| Best for | Complex data exploration | Microsoft shops and budgets |
| Ease of use | Steeper learning curve | Easier for Excel users |
| Pricing | More expensive | More affordable |
| Data size | Handles huge datasets well | Good for medium to large |
| Visualization | Industry-leading flexibility | Good, improving quickly |

What is Tableau?
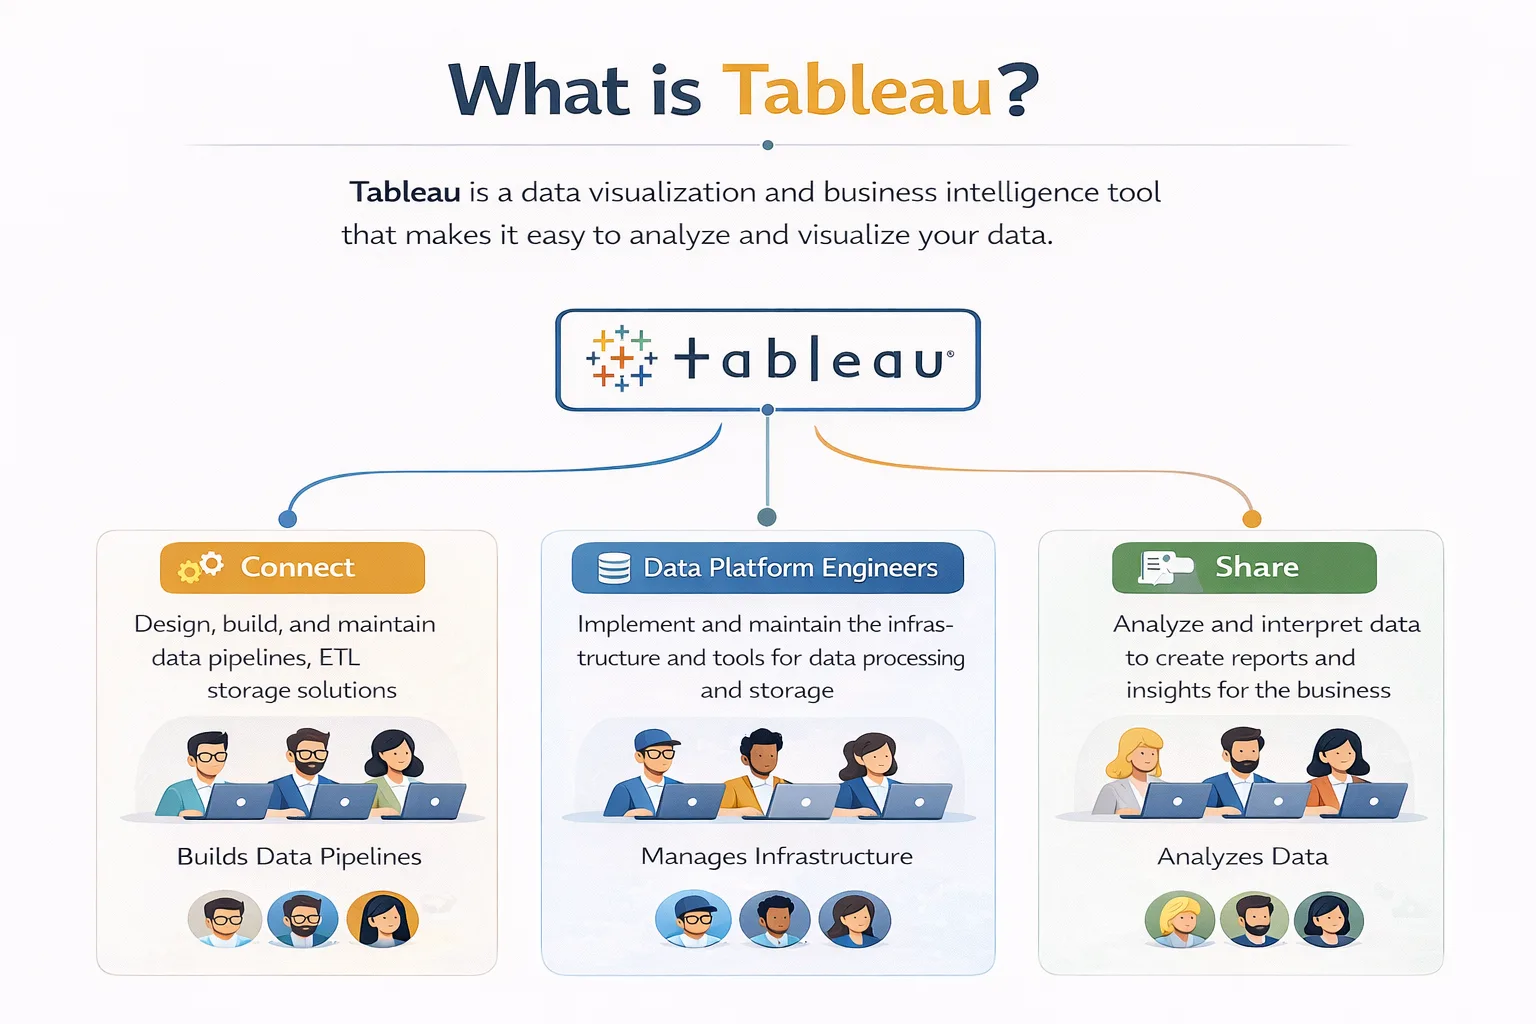
Tableau is a software used in data visualization services. It is mainly meant for exploring your data.
It was founded back in 2003 and rapidly became popular for the insights it generated
With Tableau, one can easily create visualizations from the available data
You can also drag and drop important data points in this program without having to write any code.
Thus, Tableau is a great data tool for data analysts and scientists. It supports deeper exploration into data points with minimal confusion.
What is Power BI?
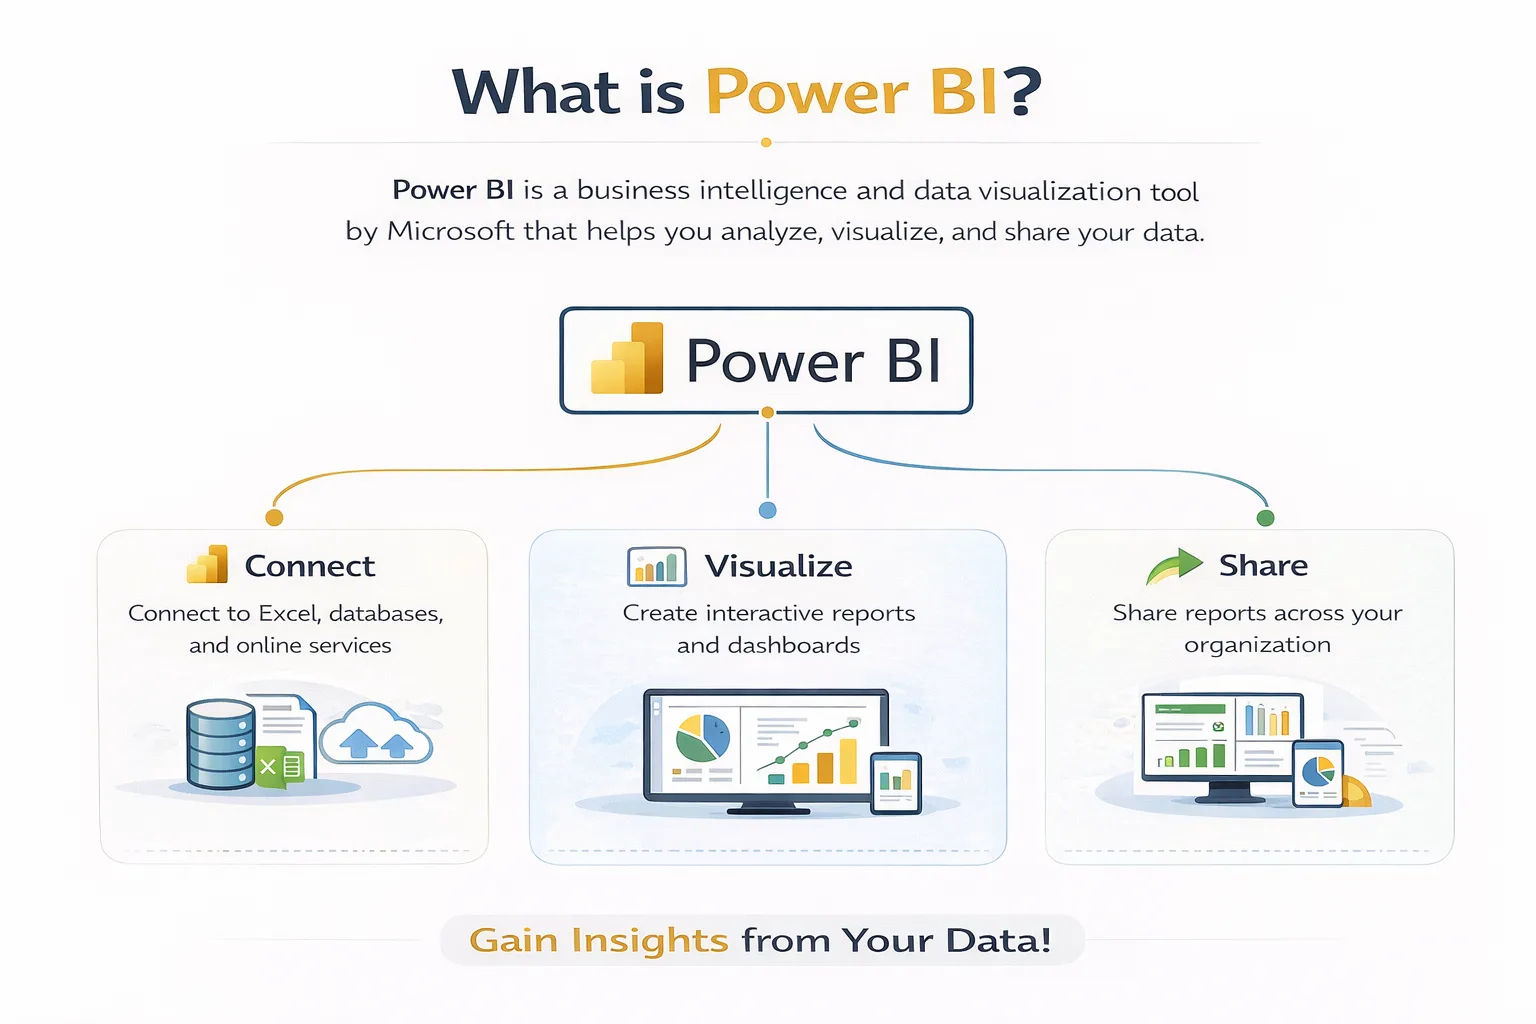
Power BI is a Microsoft-developed software alternative for data analysis.
It was launched in 2014 and has been rapidly gaining popularity among its users
One of the best benefits of Power BI is its integration capabilities. It can easily connect to other Microsoft products using Power BI consulting
This makes Power BI ideal for businesses already working with Microsoft tools.
Tableau vs Power BI: Key Differences
Let us now compare Power BI vs Tableau in greater depth.
-
Ease of Use
In terms of ease of access, Power BI is a clear winner.
The interface seems very familiar as it resembles Excel. Most business users can thus create basic reports without advanced learning.
In comparison, Tableau takes significantly more time to learn.
-
Data Visualization
Tableau is a lot more flexible than Power BI. It can handle complex interactive visuals with ease.
But Power BI is slowly catching up. This is because Microsoft continues to add new visual types to Power BI.
-
Pricing
Costs are where Power BI is a clear winner. It costs only about $10-14 per user per month.
Tableau is significantly pricier. It can drive your costs up to $70-75 per user per month.
For large enterprises, the high costs of Tableau can quickly add up.
-
Data Connection
As I said before, Power BI has deep integrations with Microsoft products. Sources like Excel, Azure, and SQL are easy to set up.
Tableau is great at everything else. Alongside Microsoft sources, it supports over 80 additional data sources.
Thus, for cloud databases and big data platforms, Tableau is the better choice.
When to Choose Power BI
So, is Power BI better than Tableau?
The answer depends on your situation.
Here are scenarios where Power BI makes more sense:
| Situation | Why Power BI |
| You use Microsoft tools | Native integration with Excel and Azure |
| You have a tight budget | Much lower per-user cost |
| Your team knows Excel | Similar interface, faster adoption |
| You need basic dashboards | Power BI handles most business needs |
When to Choose Tableau
In comparison to Power BI, here is when you should use Tableau instead:
| Situation | Why Tableau |
| You explore complex data | Tableau’s drag-and-drop exploration is unmatched |
| You need advanced visuals | More customization and flexibility |
| You handle huge datasets | Tableau performs better at scale |
| You have a budget for training | Steeper learning curve, but more powerful |
Can You Use Both Tableau and Power BI?
Yes, absolutely!
Many companies use both Tableau and Power BI together for better efficiency.
Here is how this hybrid approach works:
- You can use Power BI to handle standard reporting and dashboards
- Switch over to Tableau for deeper data exploration and complex insights
Quick Decision Guide
Still confused between the two tools?
Here are my recommendations based on your needs:
| Question | If Yes | If No |
| Do you use Microsoft tools? | Lean toward Power BI | Consider Tableau |
| Is the budget a concern? | Power BI | Tableau is fine |
| Do you need advanced visuals? | Tableau | Power BI works |
| Does your team know Excel? | Power BI | Either tool works |
| Do you explore huge datasets? | Tableau | Both are fine |

Conclusion
Comparing Tableau and Power BI clearly shows that both offer unique benefits
Power BI is great for businesses already using Microsoft tools. It provides standard data reporting at lower costs
Meanwhile, Tableau is an advanced tool that supports larger datasets. It can handle deeper data exploration at a premium price
To ensure you choose the right tool, I suggest partnering with a software consultant
You can gain better clarity by consulting our team of industry experts at Augmented Systems
We can help your business both select and implement the right Power BI tools. Moreover, our data analytics consulting keeps you up to date with the latest tools
Also, you will receive the clear, useful insights you need to scale your business today
So, are you ready to see your data more clearly? Simply contact Augmented Systems today and receive a free consultation for your data needs!
FAQs
1. Which is better: Tableau or Power BI?
The answer to the question of Tableau vs. Power BI depends on your needs. Power BI is better for Microsoft shops and tight budgets. Tableau is better for complex data exploration and advanced visuals. Both are excellent data visualization tools.
2. Is Power BI better than Tableau for beginners?
Is Power BI better than Tableau for beginners? Yes. Power BI has a gentler learning curve, especially for Excel users. Tableau is more powerful but takes longer to master.
3. Can I use both Tableau and Power BI together?
Yes, many companies use both Tableau and Power BI. Power BI handles standard corporate reporting. Tableau handles deep data exploration and complex visualizations. They complement each other well.
4. What are the main differences between Tableau and Power BI?
The main differences between Power BI and Tableau are pricing (Power BI is cheaper), ease of use (Power BI is easier), and visualization flexibility (Tableau wins). Your choice depends on budget, team skills, and data complexity.
5. Which data visualization tool should my business choose?
Consider professional data visualization services if you’re unsure. Experts can assess your needs, data sources, and budget to recommend the right tool. They can help you decide whether you need Tableau, Power BI, or both.